Help & supportMap and filters
Map and filters
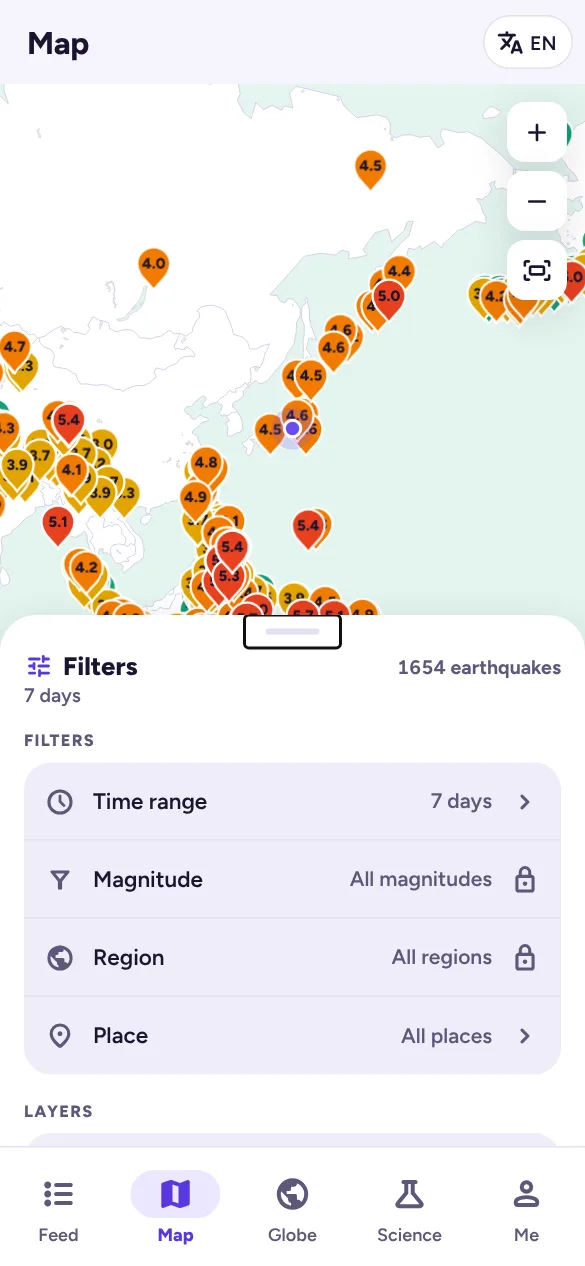
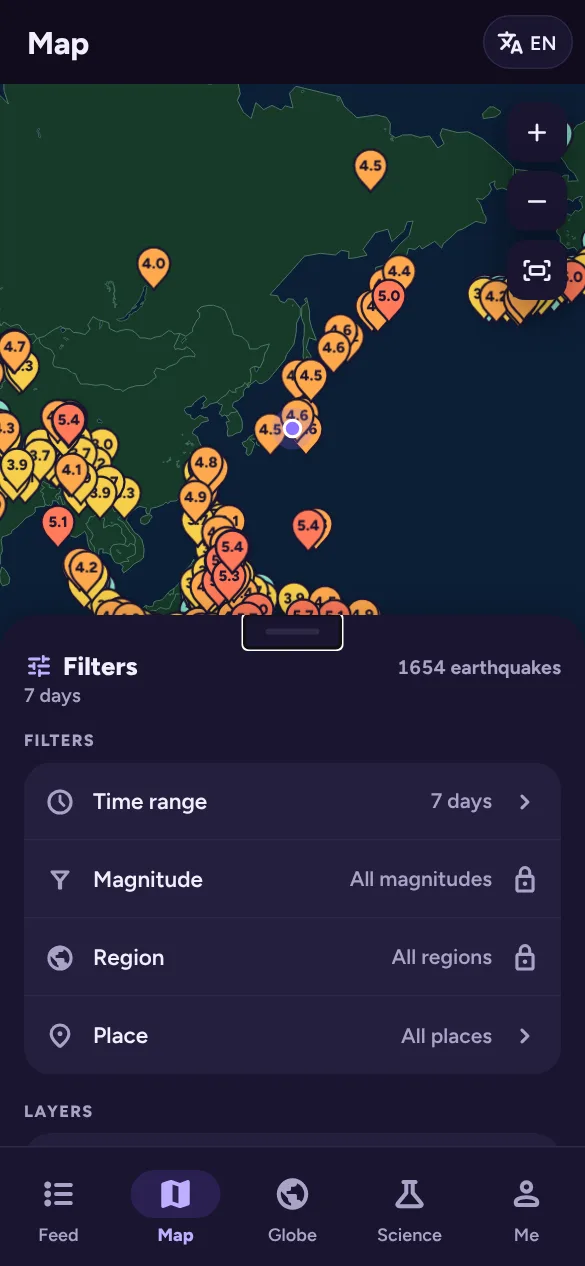
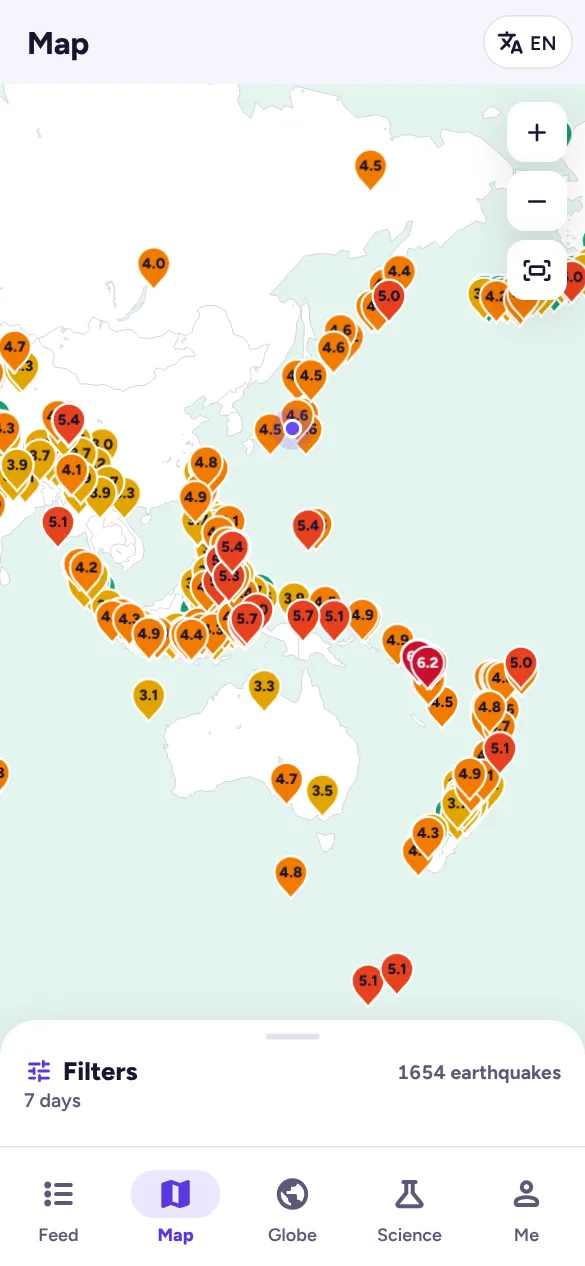
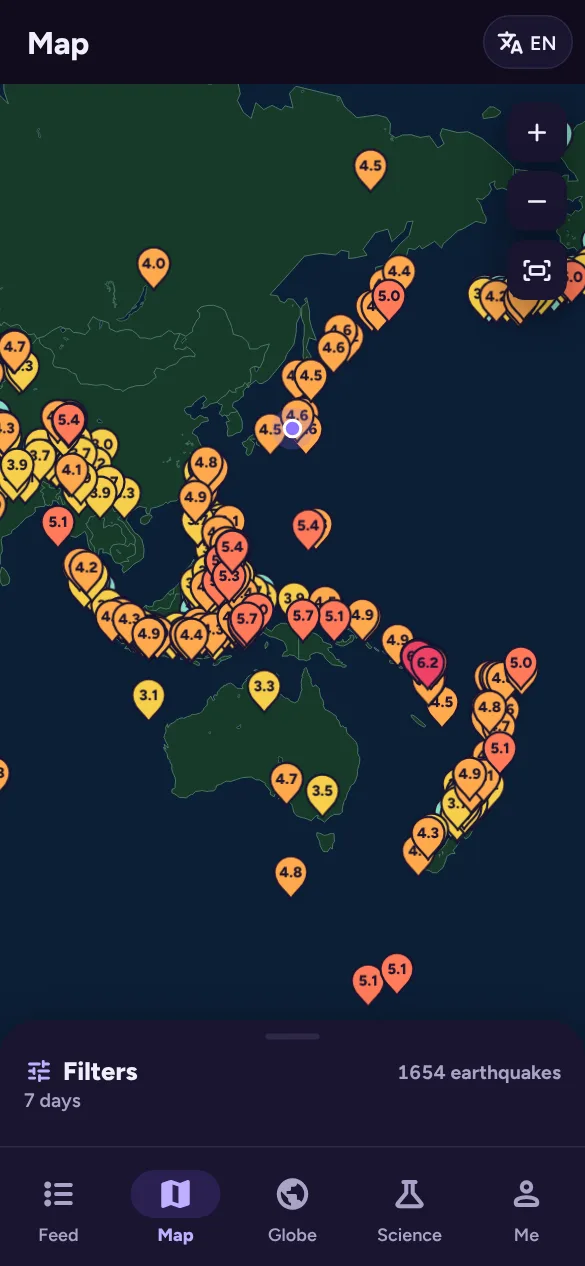
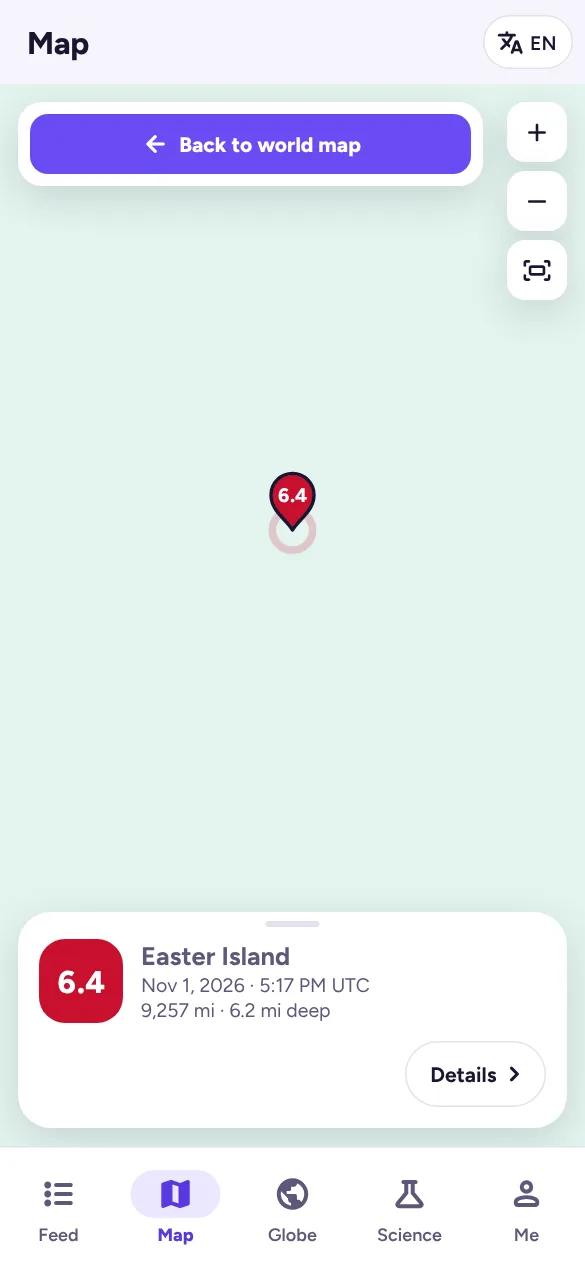
The Map tab shows recent earthquakes as pins coloured by magnitude, centred on your part of the world.
- Move and zoom with your fingers or mouse, or with the + and − buttons. The third button resets the view.
- Zoom in far enough and street maps from OpenStreetMap fade in, so you can see exactly where an event was.
- Tap a pin to see a summary card, then Details for everything about it.
Region view
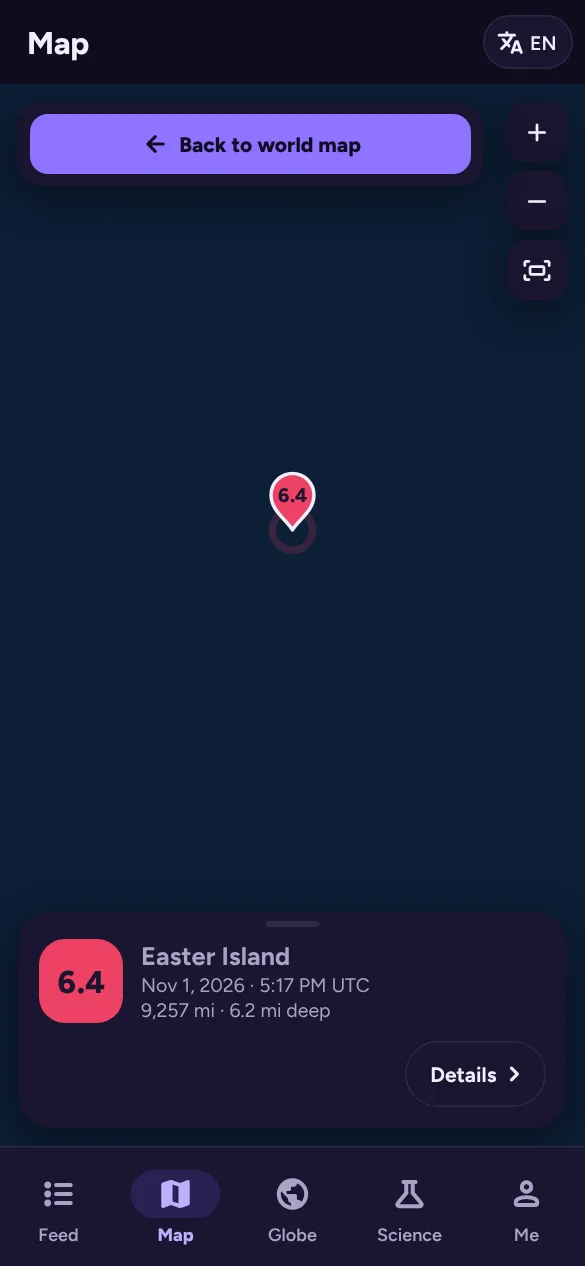
Show region on an earthquake opens a close-up about 800 km across around it, with a pulsing marker on the event and labels on nearby earthquakes. Tap Back to world map to return.
The region view is also what opens when someone follows a link you shared.
Filters, layers and legend
Pull up the Filters panel at the bottom of the Feed, Map or Globe. Tap it once to open it halfway, again to open it fully, or drag it.
- Time range: 24 hours, 7 days or 30 days. A full year needs sisma+.
- Magnitude and Region (a country or ocean region) are sisma+ filters, marked with a lock on the free plan.
- Place: show only earthquakes near one of your saved locations.
- Clear filters puts everything back.
Under Layers you can show tectonic plate boundaries. The panel also shows the magnitude legend.
Choosing a region also zooms the map to it and turns the globe to face it.